Through the previous posts on this Dynamics CRM meets Machine Learning series, so far we have covered that how Machine Learning (referred as ML hereafter), when actively involved with Dynamics CRM can help us determining and maintaining customer happiness. The business problem has been defined with a proposed architecture to achieve this.
Dynamics CRM behaviour points
The definition of a happy customer varies from one organisation to another.
For a customer service focussed organisation, it can be determined by
- Average number of hours/days taken to resolve a case
- Feedback ratings provided by the customers on cases and the customer reps
- Average wait time spent by the customer over phone/chat before being put through to the support team
- Tone of the message within an email or phone call
For a sales focussed organisation, it can be based on
- Number of quotes declined by the customer
- Number of revisions to the sales order or the contract document
- Number of times sales staff did not respond to customer meetings or phone calls
- Number of irate or happy messages received over company’s Facebook portal
Other advanced behaviour points can also be taken into consideration. For example, if a customer did not renew the contract, as a post-mortem analysis it can be checked
- if they recently had any tickets that were open for too long
- if they recently had their request for loyalty discount denied
- if they recently emailed about the sales manager not returning their phone calls
Of course the system can only use the information which has been recorded, as its yardstick for customer satisfaction. It won’t know that the customer is actually unhappy because last month you missed inviting them to your annual company party, or if your support rep chose not to record a feedback from the customer regarding a missed shipment. It’s not there yet .. !!
Now all these data points discussed above are part of the equation that can be used to determine a particular behaviour of interest. This is where a data scientist’s role pitches in, to collect the most fruitful behaviour points that closely correlate to the behaviour being measured.
Aggregated Happiness Index
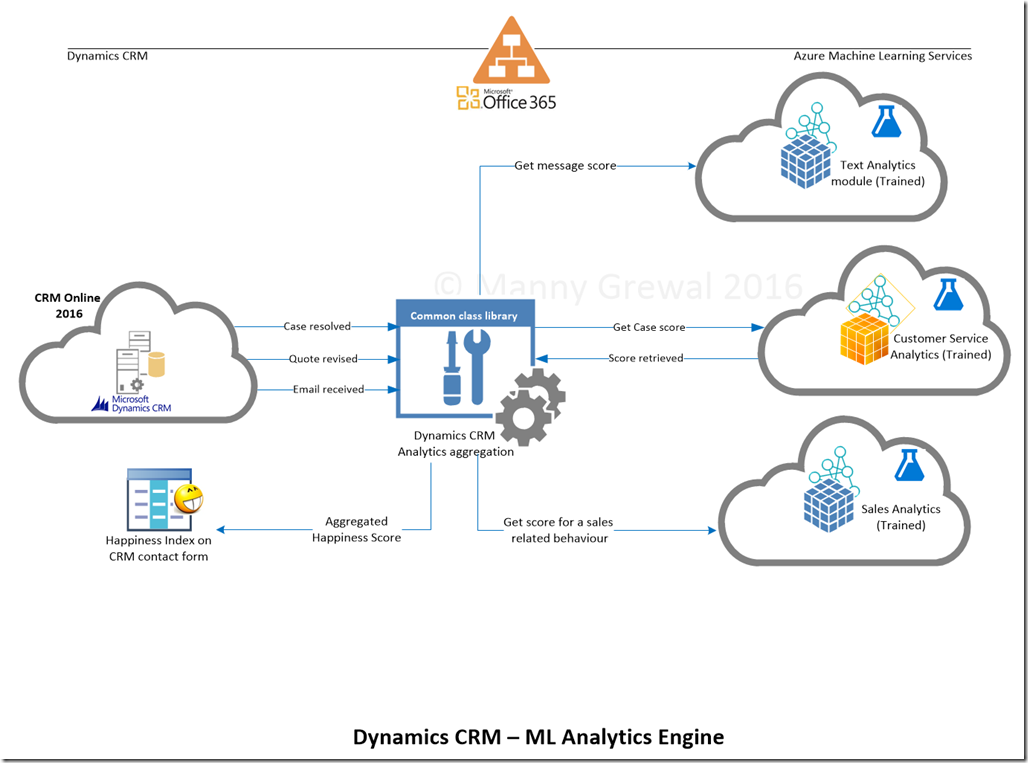
Once the behaviour points have been agreed upon with the customer, they can be factored into the Happiness Index calculation. Below is an example of how it may look like in a customer scenario.
As you can notice, as soon as a case is resolved or a quote is revised (or data from a behaviour point is available), we get its score by calling the appropriate ML service and update the aggregated happiness index score onto the contact record. A common plugin or workflow library can be used and its handler can be added to all the events pertaining to behaviour points e.g. quote revise event, case resolve event, etc..
Use behaviour points to train the ML engine
Over to the ML module now, we will use supervised learning to train our engine to interpret the behaviour points. For the simplicity of this series, I will use just the content of the email message as the only factor in determining the Happiness Index. After all the focus of the series is on an end-to-end integration.
Let me explain in simple terms what supervised learning means in our context
- You choose two classes (categories): happy (4) and unhappy (0)
- Then you feed training data (e.g. thousands of email messages) already classified as either in happy class or unhappy class into the engine
- Training process runs and it uses techniques like feature hashing to interpret data and find commonality between traits of data in either class
Below are some of these traits that can be used
| Behaviour point | Happy trait | Unhappy trait |
| Case resolution time | Case resolution time within SLA | Case resolution time double than expected SLA |
| Quote revisions | Within accepted threshold (smooth deal) | too many revisions (going back and forth) |
| Words in the email | good job doing well |
frustrated why are you not replying? |
Once trained, the engine can do scoring with a certain probability e.g. given a sentence it can tell you if it is 0 or 4 and how much certain it is e.g. engine will say I’m 85% certain that You are replying late is a unhappy message. It will return the result 0 and probability 0.85 for this input.
ML engine
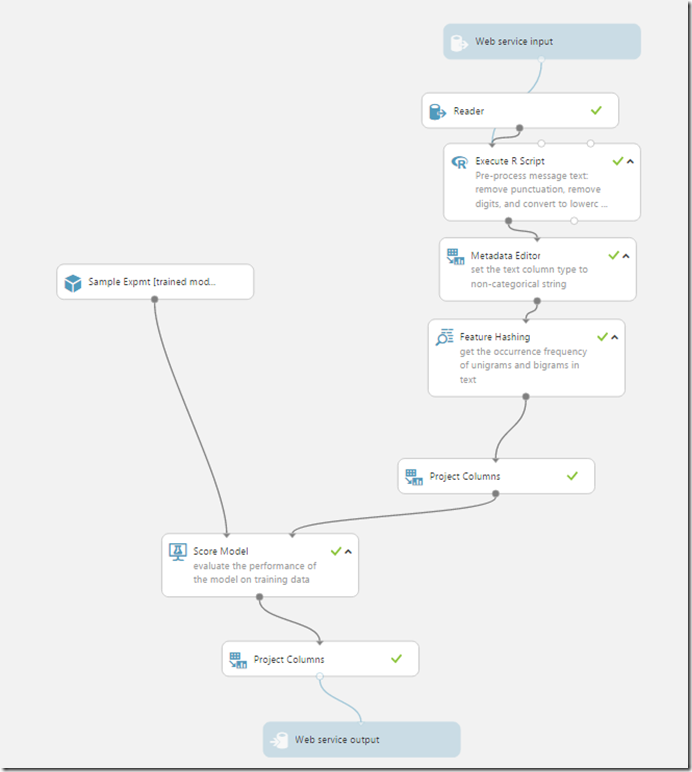
Below is a screenshot of the experiment that I have used for my email message binary classifier. I would not go into the detail and setup of each step but basically it takes message body as input and returns a score: (0) for unhappy and (4) for happy. Only two states – 0 or 4.
Next week we will cover how to deploy this Machine Learning Service and consume it from within Dynamics CRM.
Thanks for reading and comments are welcome.


Thanks for the information. This is excellent.
Just had a question regarding to the Service Input. can you please point out how you connect Azure ML studio to CRM. I have tried Odata but no luck. Thanks
LikeLike
Because of CRM authentication, you cannot read using OData. I trained my model from within Azure ML (Load Data control), then CRM can connect to it over REST web service.
LikeLike
Hello Manny,
Can you let me know which sample experiment you are using for read email body.
I have not found related data set or related experiment sample.
Thanks,
Rinkesh
LikeLike
From memory it was twitter messages sample that comes with Azure ML.
LikeLike
Hello,
I want same thing which you explained in your blogs but i am stuck on experiment. i have created data set manually and added some records to it. when i visualize the score model , got only zero output. According to algorithm it should be 0 or 4.
Can you help me.
Thanks,
Rinkesh
LikeLike
Hello,
I want to create an experiment which will be used to read the body of emails and will return a score i.e 0 or 4.
if the mail body has appreicate message like (You done a good job. etc) it will return 4 and
if content has disagree message
like(Not satisfied)it will return 0.
Kindly suggest which sample data set need to be used to achieve the same.
Will appreiaciate if you will provide the steps with proper dataset and algorithem.
Thanks in advance.
Regards,
Rinkesh Rathore
LikeLike
There are some free sentiment WS available over the internet. Basically you query the WS with your input text and it gives you a sentiment score and confidence. Alternatively you can build your own and deploy it as WS in Azure ML. I built my own using 40,000 twitter messages corpus. Below is the link to the corpus http://gallery.cortanaintelligence.com/Experiment/Binary-Classification-Twitter-sentiment-analysis-4?share=1
LikeLike
Hi,
I am trying to create new experiment and adding required data-set into this but no luck.
Can you please help me how to create new experiment and how to add required data set into this regarding email sentiment.
Thanks
Ajeet
LikeLike
Adding dataset is easy, goto Data Input/Output controls in the Azure ML experiment and it takes csv file or Azure table. For sentiment analysis there are free webservices available, you call them, pass the text that need to be analysed and they give you sentiment and confidence %age. Search on net for free web services and call them using REST.
LikeLike
Thanks Manny !
Its Help Me a lot.
Regards,
Rinkesh Rathore
LikeLike